MT4指标编译通过 · EX4 14KB 10 6
结构高低点 + 趋势线(MT4)
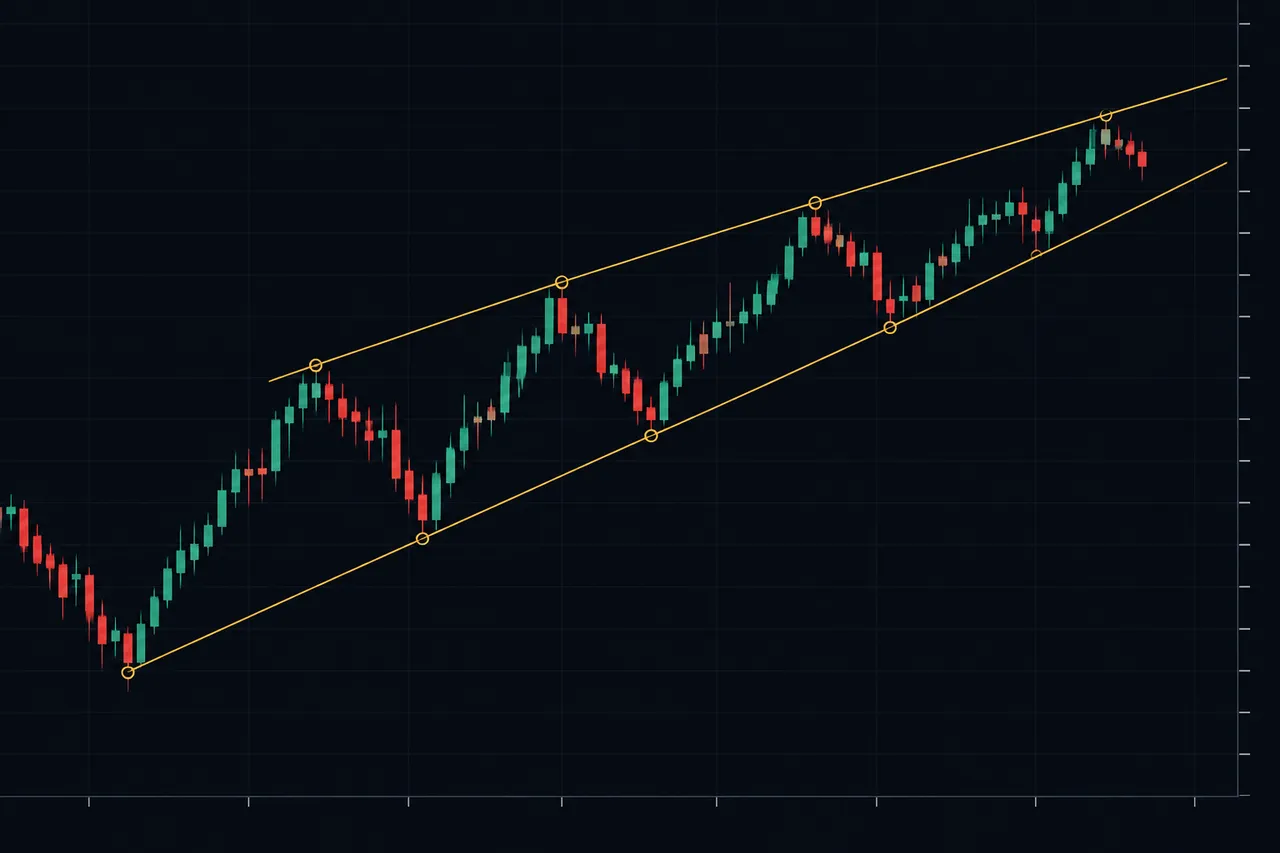
自动标出摆动高低点,连成结构趋势线,破结构时变色提示
结构高低点_趋势线_MT4.mq4282 行
1
2
3
4
5
6
7
8
9
10
11
12
13
14
15
16
17
18
19
20
21
22
23
24
25
26
27
28
29
30
31
32
33
34
35
36
37
38
39
40
41
42
43
44
45
46
47
48
49
50
51
52
53
54
55
56
57
58
59
60
61
62
63
64
65
66
67
68
69
70
71
72
73
74
75
76
77
78
79
80
81
82
83
84
85
86
87
88
89
90
91
92
93
94
95
96
97
98
99
100
101
102
103
104
105
106
107
108
109
110
111
112
113
114
115
116
117
118
119
120
121
122
123
124
125
126
127
128
129
130
131
132
133
134
135
136
137
138
139
140
141
142
143
144
145
146
147
148
149
150
151
152
153
154
155
156
157
158
159
160
161
162
163
164
165
166
167
168
169
170
171
172
173
174
175
176
177
178
179
180
181
182
183
184
185
186
187
188
189
190
191
192
193
194
195
196
197
198
199
200
201
202
203
204
205
206
207
208
209
210
211
212
213
214
215
216
217
218
219
220
221
222
223
224
225
226
227
228
229
230
231
232
233
234
235
236
237
238
239
240
241
242
243
244
245
246
247
248
249
250
251
252
253
254
255
256
257
258
259
260
261
262
263
264
265
266
267
268
269
270
271
272
273
274
275
276
277
278
279
280
281
282
//+------------------------------------------------------------------+
//|                                            SwingPointTrendLine.mq4 |
//|                                       量化交易摆动点趋势线指标      |
//+------------------------------------------------------------------+
#property copyright "Swing Point Trend Line Indicator"
#property link      ""
#property version   "1.00"
#property strict
#property indicator_chart_window

//---- 可调参数
input int    SwingBars = 5;              // 左右比较的K线数量(推荐3-10)
input bool   ShowTrendLines = true;      // 是否显示趋势线
input color  UpTrendColor = clrLime;     // 上升趋势线颜色
input color  DownTrendColor = clrRed;    // 下降趋势线颜色
input int    LineWidth = 2;              // 趋势线粗细(1-5)

//---- 指标缓冲区
double HighDots[];    // 摆动高点标记
double LowDots[];     // 摆动低点标记

//---- 全局变量
datetime lastHighTime1 = 0, lastHighTime2 = 0;  // 最近两个高点时间
double   lastHighPrice1 = 0, lastHighPrice2 = 0; // 最近两个高点价格
datetime lastLowTime1 = 0, lastLowTime2 = 0;    // 最近两个低点时间
double   lastLowPrice1 = 0, lastLowPrice2 = 0;   // 最近两个低点价格

string upTrendLineName = "UpTrendLine";
string downTrendLineName = "DownTrendLine";

//+------------------------------------------------------------------+
//| 指标初始化函数                                                      |
//+------------------------------------------------------------------+
int OnInit()
{
   // 设置指标缓冲区
   SetIndexBuffer(0, HighDots);
   SetIndexStyle(0, DRAW_ARROW);
   SetIndexArrow(0, 159);  // 小圆点符号
   SetIndexLabel(0, "摆动高点");

   SetIndexBuffer(1, LowDots);
   SetIndexStyle(1, DRAW_ARROW);
   SetIndexArrow(1, 159);
   SetIndexLabel(1, "摆动低点");

   // 设置点的颜色
   SetIndexStyle(0, DRAW_ARROW, EMPTY, EMPTY, clrRed);
   SetIndexStyle(1, DRAW_ARROW, EMPTY, EMPTY, clrLime);

   // 清空之前的趋势线
   ObjectDelete(0, upTrendLineName);
   ObjectDelete(0, downTrendLineName);

   return(INIT_SUCCEEDED);
}

//+------------------------------------------------------------------+
//| 指标清理函数                                                        |
//+------------------------------------------------------------------+
void OnDeinit(const int reason)
{
   // 删除趋势线对象
   ObjectDelete(0, upTrendLineName);
   ObjectDelete(0, downTrendLineName);
   Comment("");  // 清空提示文字
}

//+------------------------------------------------------------------+
//| 主计算函数                                                          |
//+------------------------------------------------------------------+
int OnCalculate(const int rates_total,
                const int prev_calculated,
                const datetime &time[],
                const double &open[],
                const double &high[],
                const double &low[],
                const double &close[],
                const long &tick_volume[],
                const long &volume[],
                const int &spread[])
{
   // 数据不足时返回
   if(rates_total < SwingBars * 2 + 1)
      return(0);

   // 确定计算起点
   int start = SwingBars;
   if(prev_calculated > SwingBars)
      start = rates_total - 1;

   // 初始化缓冲区
   ArrayInitialize(HighDots, EMPTY_VALUE);
   ArrayInitialize(LowDots, EMPTY_VALUE);

   // 遍历K线识别摆动点
   for(int i = rates_total - 1 - SwingBars; i >= SwingBars; i--)
   {
      // 检查是否为摆动高点
      bool isSwingHigh = true;
      for(int j = 1; j <= SwingBars; j++)
      {
         // 检查索引范围
         if(i + j >= rates_total || i - j < 0)
         {
            isSwingHigh = false;
            break;
         }
         // 左右都不能有更高的高点
         if(high[i + j] >= high[i] || high[i - j] >= high[i])
         {
            isSwingHigh = false;
            break;
         }
      }

      // 如果是摆动高点,标记并记录
      if(isSwingHigh)
      {
         HighDots[i] = high[i] + 10 * Point;  // 在高点上方显示

         // 更新最近两个高点
         if(time[i] > lastHighTime1)
         {
            lastHighTime2 = lastHighTime1;
            lastHighPrice2 = lastHighPrice1;
            lastHighTime1 = time[i];
            lastHighPrice1 = high[i];
         }
         else if(time[i] > lastHighTime2)
         {
            lastHighTime2 = time[i];
            lastHighPrice2 = high[i];
         }
      }

      // 检查是否为摆动低点
      bool isSwingLow = true;
      for(int j = 1; j <= SwingBars; j++)
      {
         // 检查索引范围
         if(i + j >= rates_total || i - j < 0)
         {
            isSwingLow = false;
            break;
         }
         // 左右都不能有更低的低点
         if(low[i + j] <= low[i] || low[i - j] <= low[i])
         {
            isSwingLow = false;
            break;
         }
      }

      // 如果是摆动低点,标记并记录
      if(isSwingLow)
      {
         LowDots[i] = low[i] - 10 * Point;  // 在低点下方显示

         // 更新最近两个低点
         if(time[i] > lastLowTime1)
         {
            lastLowTime2 = lastLowTime1;
            lastLowPrice2 = lastLowPrice1;
            lastLowTime1 = time[i];
            lastLowPrice1 = low[i];
         }
         else if(time[i] > lastLowTime2)
         {
            lastLowTime2 = time[i];
            lastLowPrice2 = low[i];
         }
      }
   }

   // 绘制趋势线
   if(ShowTrendLines)
   {
      DrawTrendLines();
   }

   // 检查价格突破
   CheckBreakout(close[0]);

   return(rates_total);
}

//+------------------------------------------------------------------+
//| 绘制趋势线                                                          |
//+------------------------------------------------------------------+
void DrawTrendLines()
{
   // 删除旧的趋势线
   ObjectDelete(0, upTrendLineName);
   ObjectDelete(0, downTrendLineName);

   // 绘制下降趋势线(连接两个高点)
   if(lastHighTime1 > 0 && lastHighTime2 > 0 && lastHighTime1 != lastHighTime2)
   {
      ObjectCreate(0, downTrendLineName, OBJ_TREND, 0, lastHighTime2, lastHighPrice2, lastHighTime1, lastHighPrice1);
      ObjectSetInteger(0, downTrendLineName, OBJPROP_COLOR, DownTrendColor);
      ObjectSetInteger(0, downTrendLineName, OBJPROP_WIDTH, LineWidth);
      ObjectSetInteger(0, downTrendLineName, OBJPROP_RAY_RIGHT, true);  // 延长到右边
      ObjectSetInteger(0, downTrendLineName, OBJPROP_SELECTABLE, true);
   }

   // 绘制上升趋势线(连接两个低点)
   if(lastLowTime1 > 0 && lastLowTime2 > 0 && lastLowTime1 != lastLowTime2)
   {
      ObjectCreate(0, upTrendLineName, OBJ_TREND, 0, lastLowTime2, lastLowPrice2, lastLowTime1, lastLowPrice1);
      ObjectSetInteger(0, upTrendLineName, OBJPROP_COLOR, UpTrendColor);
      ObjectSetInteger(0, upTrendLineName, OBJPROP_WIDTH, LineWidth);
      ObjectSetInteger(0, upTrendLineName, OBJPROP_RAY_RIGHT, true);
      ObjectSetInteger(0, upTrendLineName, OBJPROP_SELECTABLE, true);
   }
}

//+------------------------------------------------------------------+
//| 检查价格突破                                                        |
//+------------------------------------------------------------------+
void CheckBreakout(double currentPrice)
{
   bool breakoutDetected = false;
   string breakoutMsg = "";

   // 计算当前时间对应的趋势线价格
   datetime currentTime = TimeCurrent();

   // 检查上升趋势线突破(价格跌破)
   if(lastLowTime1 > 0 && lastLowTime2 > 0 && lastLowTime1 != lastLowTime2)
   {
      // 计算趋势线斜率
      double timeDiff = (double)(lastLowTime1 - lastLowTime2);
      if(timeDiff > 0)
      {
         double priceDiff = lastLowPrice1 - lastLowPrice2;
         double slope = priceDiff / timeDiff;

         // 计算当前时间点的趋势线价格
         double trendLinePrice = lastLowPrice1 + slope * (currentTime - lastLowTime1);

         // 价格跌破上升趋势线
         if(currentPrice < trendLinePrice)
         {
            breakoutDetected = true;
            breakoutMsg = "结构已破:跌破上升趋势线";
         }
      }
   }

   // 检查下降趋势线突破(价格突破向上)
   if(lastHighTime1 > 0 && lastHighTime2 > 0 && lastHighTime1 != lastHighTime2)
   {
      // 计算趋势线斜率
      double timeDiff = (double)(lastHighTime1 - lastHighTime2);
      if(timeDiff > 0)
      {
         double priceDiff = lastHighPrice1 - lastHighPrice2;
         double slope = priceDiff / timeDiff;

         // 计算当前时间点的趋势线价格
         double trendLinePrice = lastHighPrice1 + slope * (currentTime - lastHighTime1);

         // 价格突破下降趋势线
         if(currentPrice > trendLinePrice)
         {
            breakoutDetected = true;
            breakoutMsg = "结构已破:突破下降趋势线";
         }
      }
   }

   // 显示提示信息
   if(breakoutDetected)
   {
      Comment("\n", breakoutMsg, "\n当前价格: ", DoubleToStr(currentPrice, Digits));
   }
   else
   {
      Comment("");  // 清空提示
   }
}
作品说明
思路说明
采用经典的摆动点识别算法:对于每根K线,检查其左右各N根的高低点,如果当前高点比左右都高则标记为摆动高点,低点比左右都低则标记为摆动低点。用数组记录最近两个有效的高点和低点坐标,通过 ObjectCreate 绘制趋势线。每次tick检查当前价格是否突破趋势线(收盘价穿越),突破时在图表左上角用 Comment 显示提示文字。
使用说明
- 安装方法
- 将代码保存为
SwingPointTrendLine.mq4 - 放入 MT4 数据文件夹的
MQL4/Indicators目录 - 重启 MT4 或在导航器中右键刷新
- 拖动到图表即可使用
- 参数调整
- SwingBars:设置5表示左右各看5根K线,数值越大识别的摆动点越重要但数量越少,推荐3-10
- ShowTrendLines:设为false可隐藏趋势线,只看摆动点
- UpTrendColor/DownTrendColor:自定义趋势线颜色
- LineWidth:线条粗细1-5,数值越大越粗
- 信号解读
- 红点:摆动高点,局部最高价
- 绿点:摆动低点,局部最低价
- 红色下降线:连接最近两个高点
- 绿色上升线:连接最近两个低点
- 左上角文字:出现「结构已破」表示价格突破了趋势线,可能是趋势反转信号
- 注意事项
- 指标有延迟性,摆动点需要右侧N根K线确认后才显示
- 趋势线会自动延长到右侧,方便观察未来支撑/阻力
- 建议配合其他指标综合判断,不要单独依赖突破信号
- 不同周期图表需要调整SwingBars参数以适应波动特性
评论
后可以留言,比如反馈用着怎么样、想加什么功能。
还没有人评论,来抢个沙发。